Crypto Tax Calculator
Show the tax number first
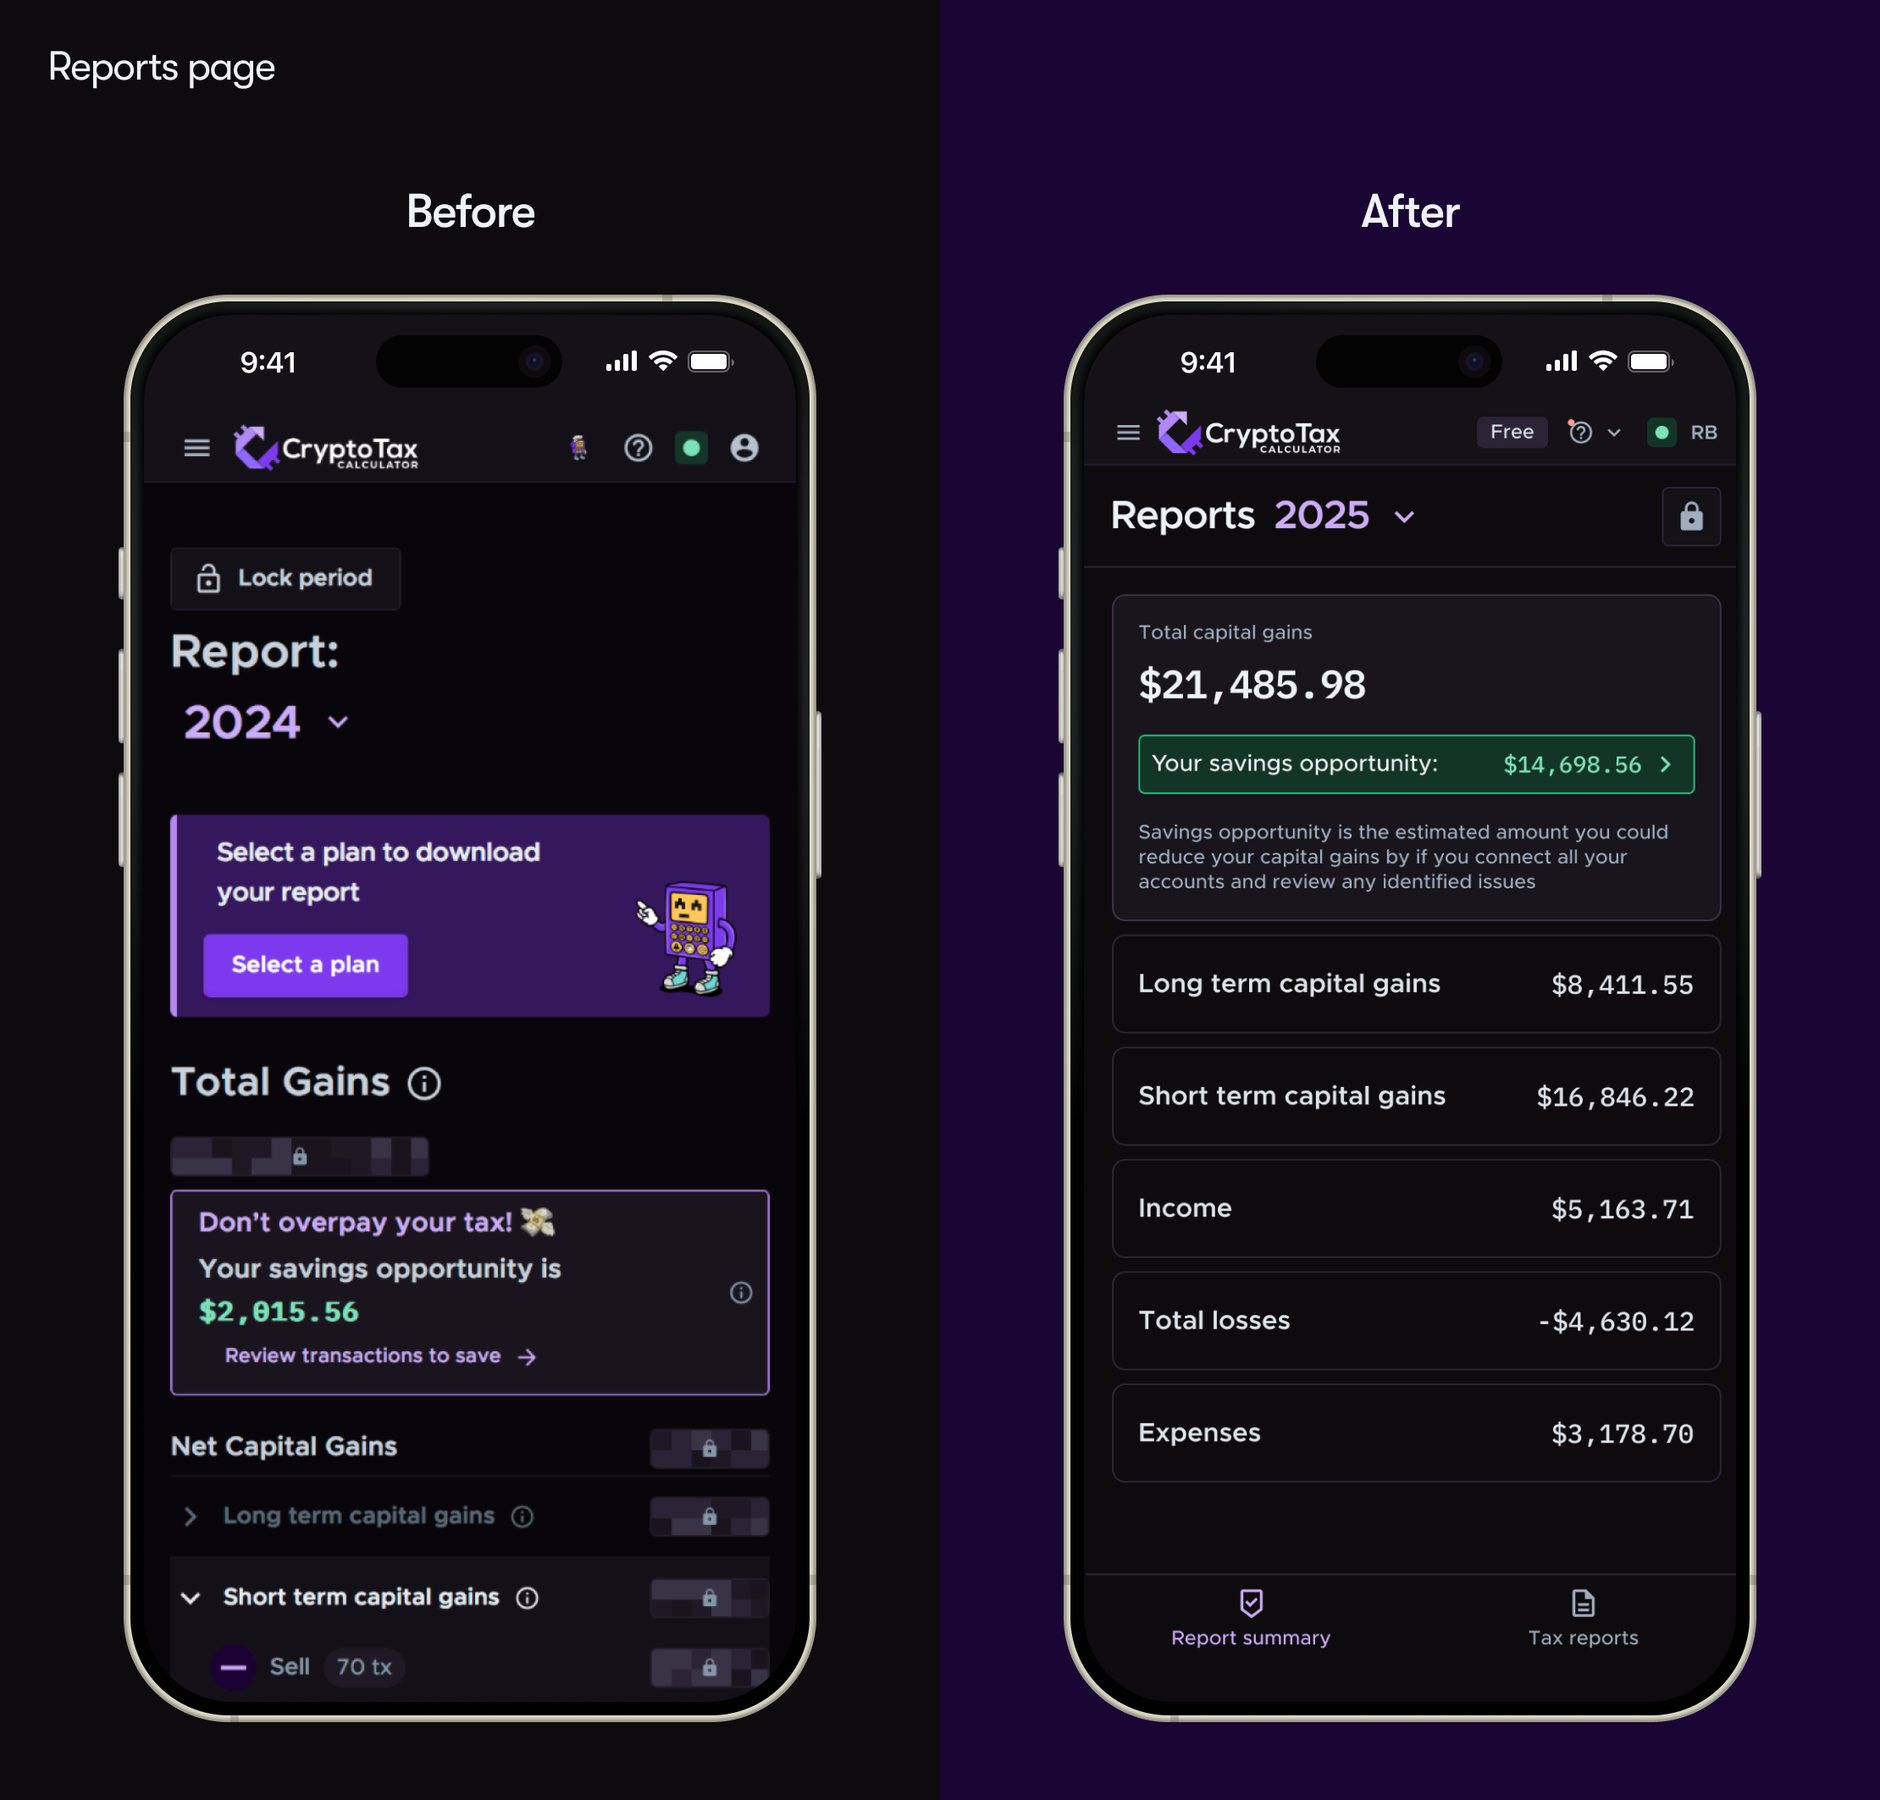
Before: a plan banner owns the fold and the tax number is locked. After: total capital gains first, then an explained savings row.
The job
Coinbase sent a large influx of new users to a product that had been designed on desktop. About 60% of those referrals arrived on a phone. The layouts had been squeezed, not redesigned. Friction concentrated where it converted: reports, then transactions and filters.
The most important number on the product — total capital gains — was often paywalled behind a blur, or sitting below a plan-selection banner that owned the fold.
Audit
A mobile UX audit before the rebuild. Recurring problems, and what they implied:
Slow interaction. Taps could take one to two seconds. That is an engineering problem. I flagged it so we were not decorating a sluggish UI.
Information overload. Too much content and too many warnings on a single screen. The screen had not decided what it was for.
Desktop patterns on a phone. Horizontal scrolling, cramped tables, cluttered filter chrome.
Hidden primary. Hierarchy was unclear, especially on reports: the plan banner was the first action, the tax number was not.
The call
Desktop density is not a layout problem. It is a “what is this screen for” problem. Reports is for “what is my tax position, and what should I do about it.”
The commercial call: show the real number, then show what connecting more accounts could save. Useful for the customer, and a stronger reason to finish importing data or buy a plan. Those two things pointing the same direction is rare enough to take when it happens.
This was a judgment call, shipped behind a feature flag — not a three-variant test of number-first versus savings-first.
Scannability
Two states, one hierarchy
Unlocked. Total capital gains first. Savings as an explained, tappable row directly underneath. The full breakdown visible without a tap. That is the after state above.
Free. The headline figure can stay locked. The plan banner does not get the fold. The savings opportunity stays visible and explained. The plan CTA sits at the bottom.
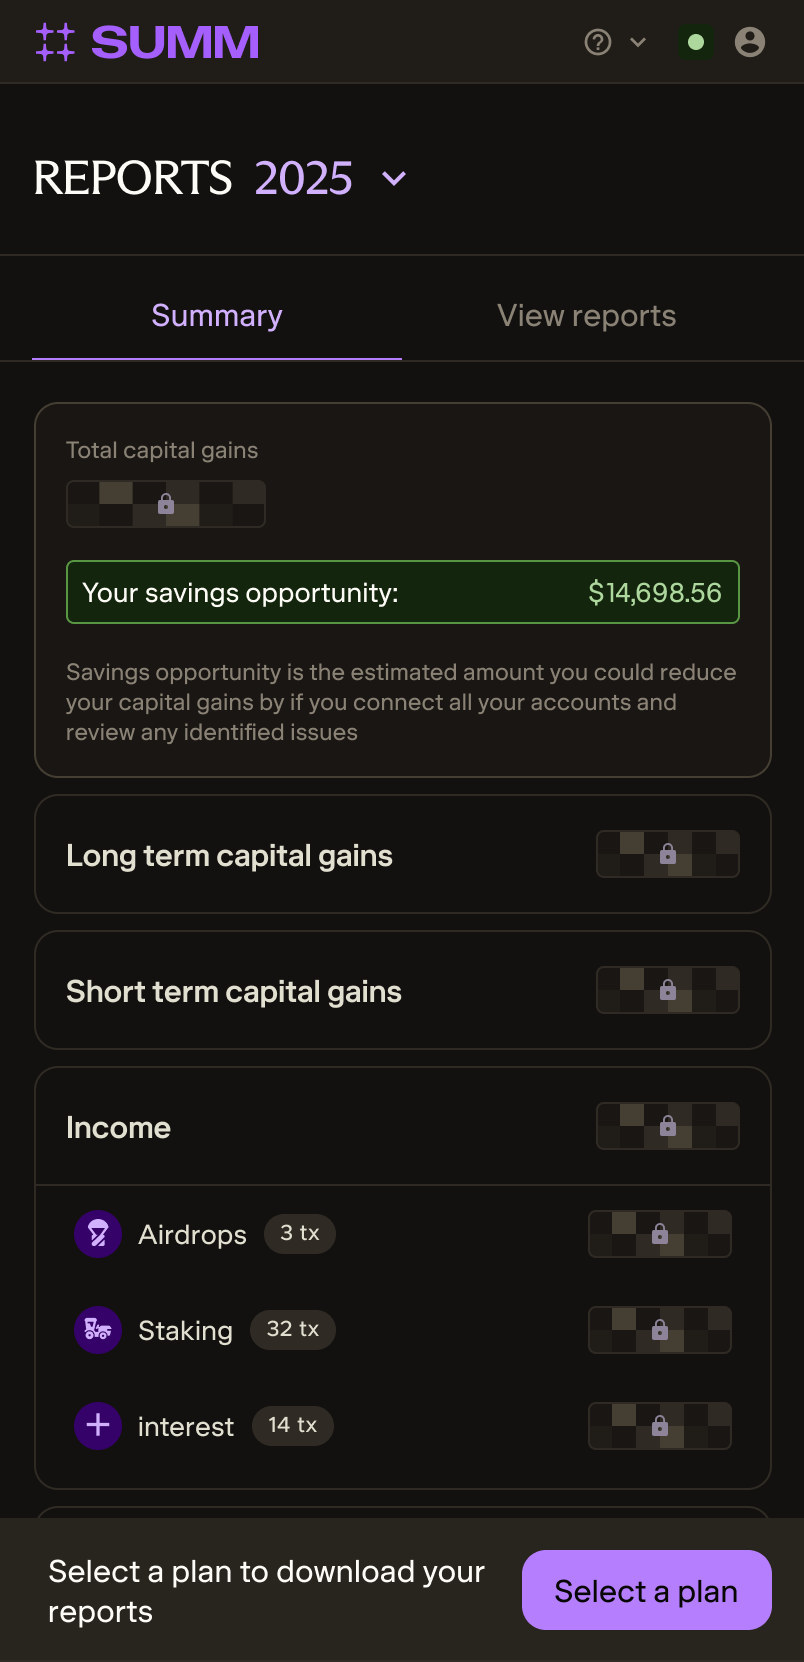
Free users: number locked, savings visible, plan CTA at the bottom.
The proof
I designed the variant. It shipped behind a feature flag and was read with a Bayesian stats engine.
The primary metric was viewed reports → purchased a plan. Control converted at 16.27%. The redesign converted at 20.84% — a 28.04% relative lift. 2,090 people in the experiment. 99.67% probability of being best. The 95% credible interval sat between +13.46% and +43.96%, all on the same side of zero.
A separate mobile onboarding-imports test ran in the same period. That result lives on the onboarding case study. It is not this project's headline.
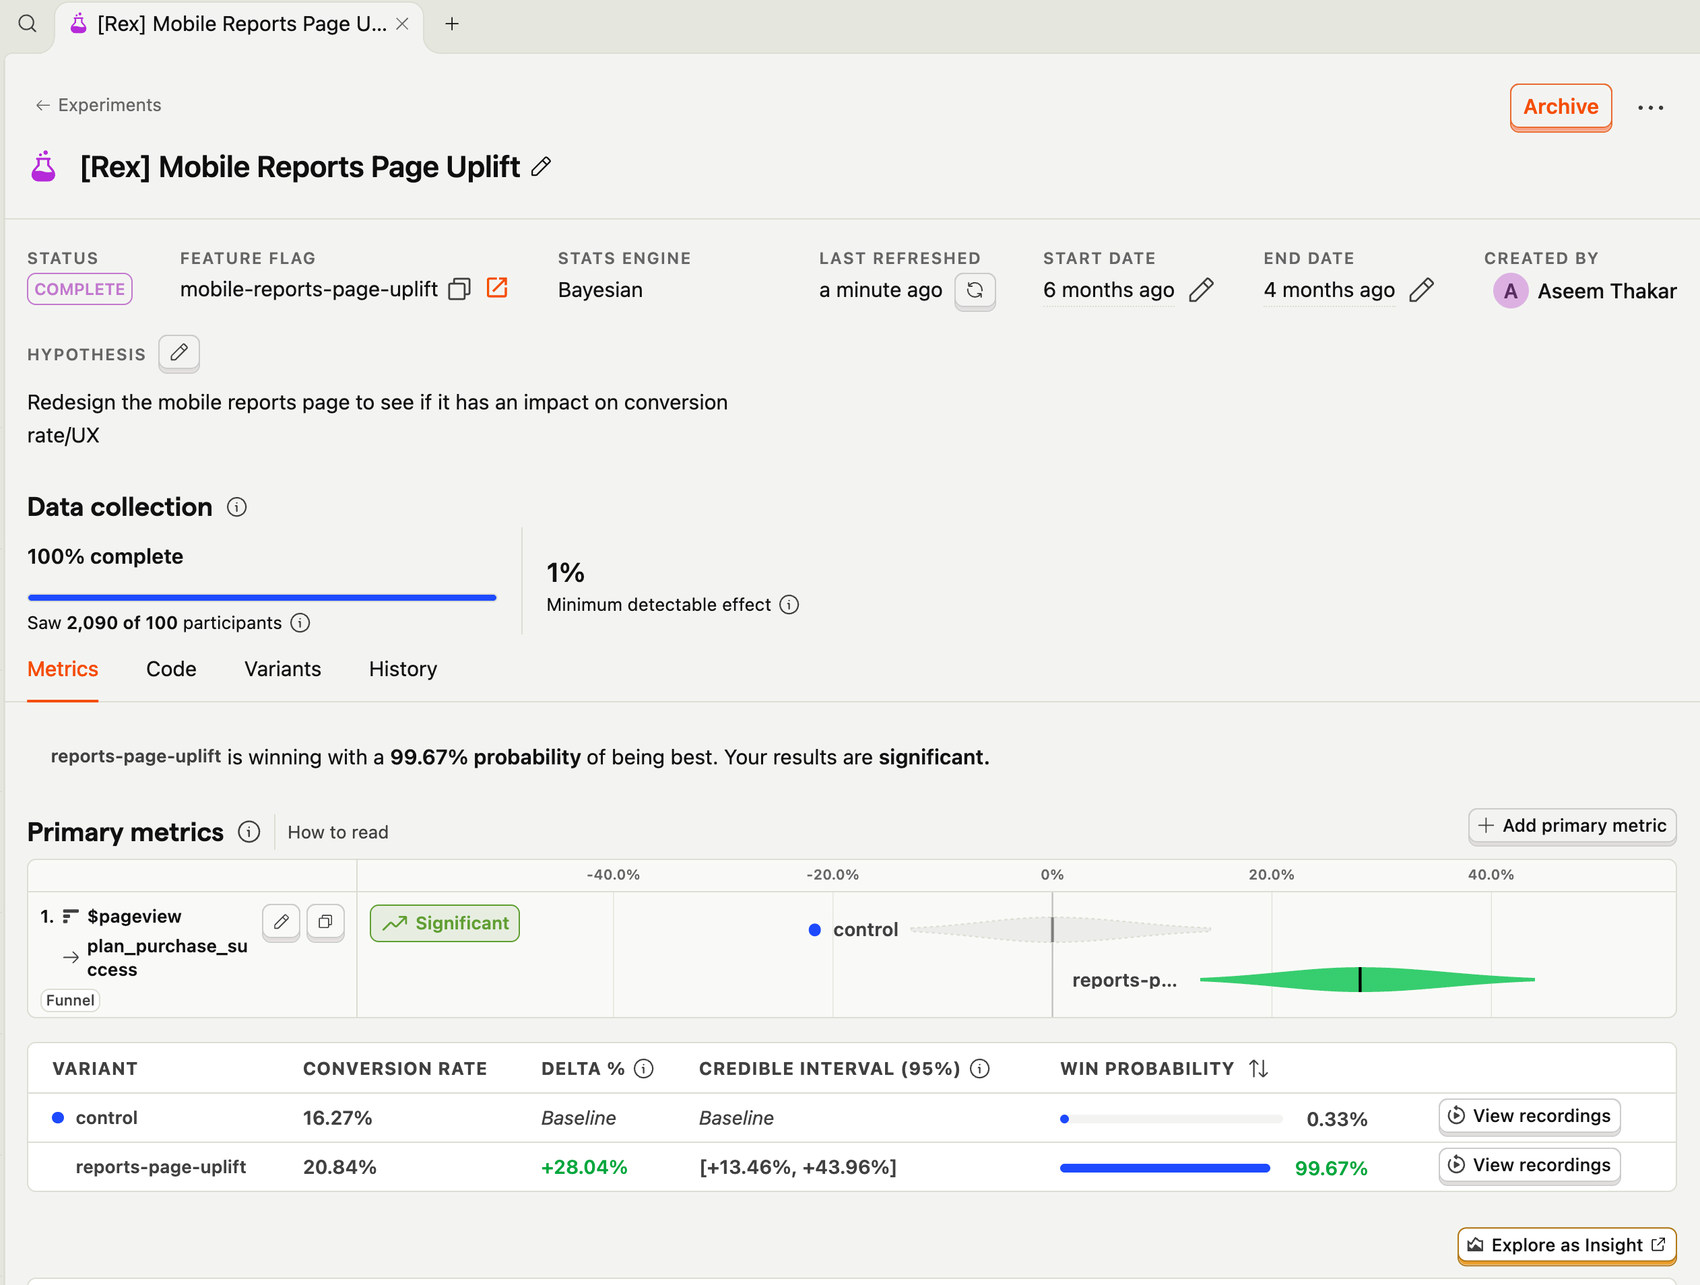
Mobile Reports Page Uplift. Bayesian, n=2,090, significant.
Company growth over the broader period is context, not a design claim. This page owns the reports experiment.
The same pattern
The reports call was the prototype for the rest of the phone: decide what the screen is for, put that first, hide the rest until it is useful, prefer patterns people already know.
Mobile familiarity
Transactions
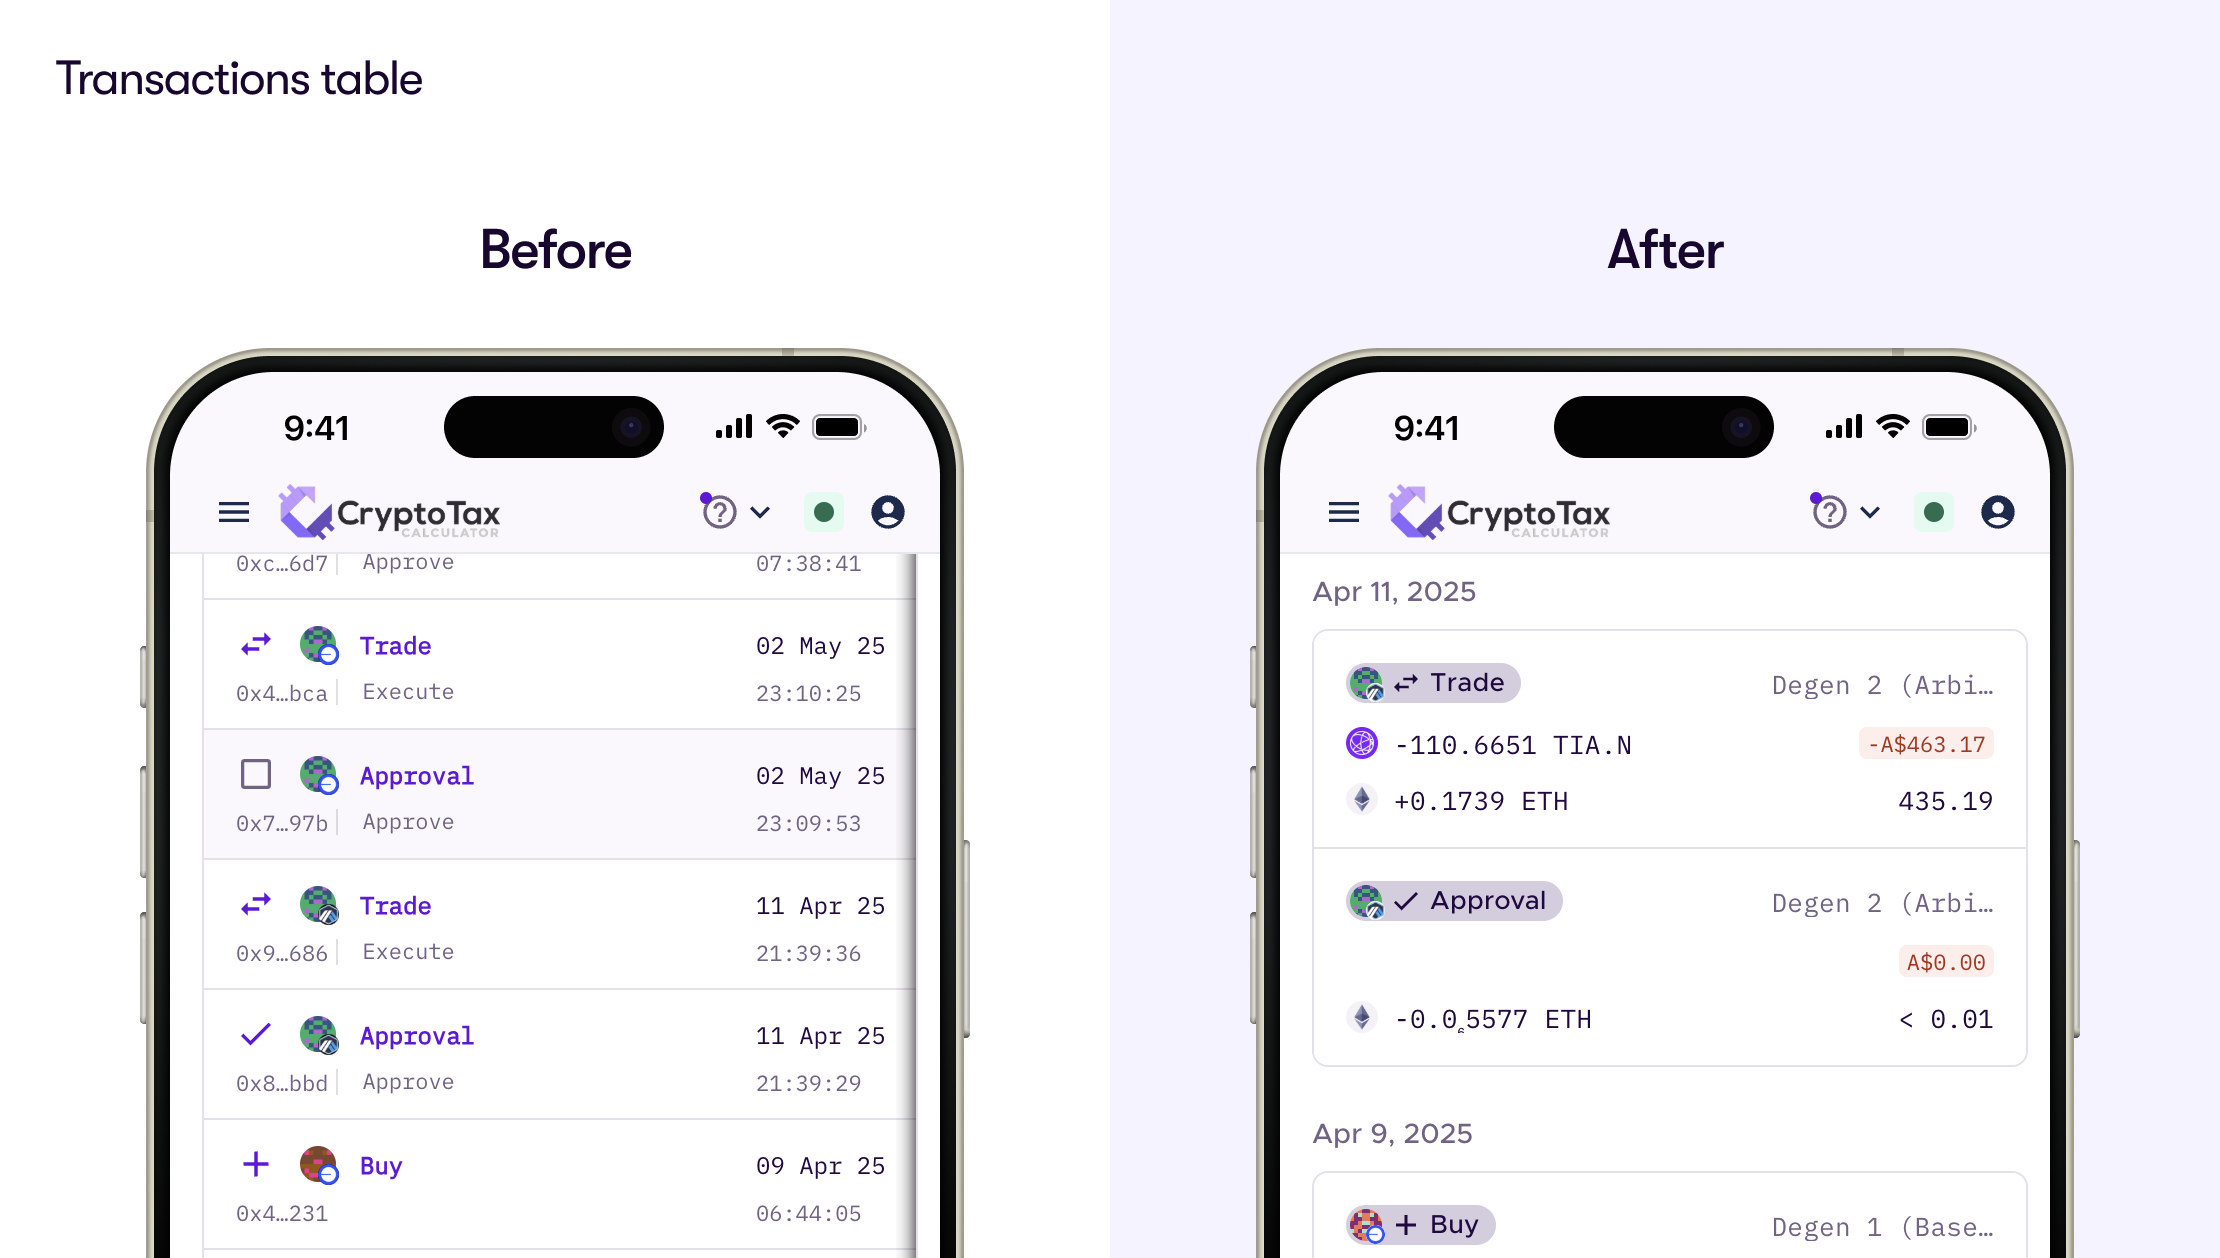
People checking history need three things: what happened, which assets moved, and what it was worth in local currency. The old table was a desktop grid compressed until a truncated hash was the most visible thing on the row. Date-grouped cards lead with type, assets, and local value. None of those is a hash.
Progressive disclosure
Filters
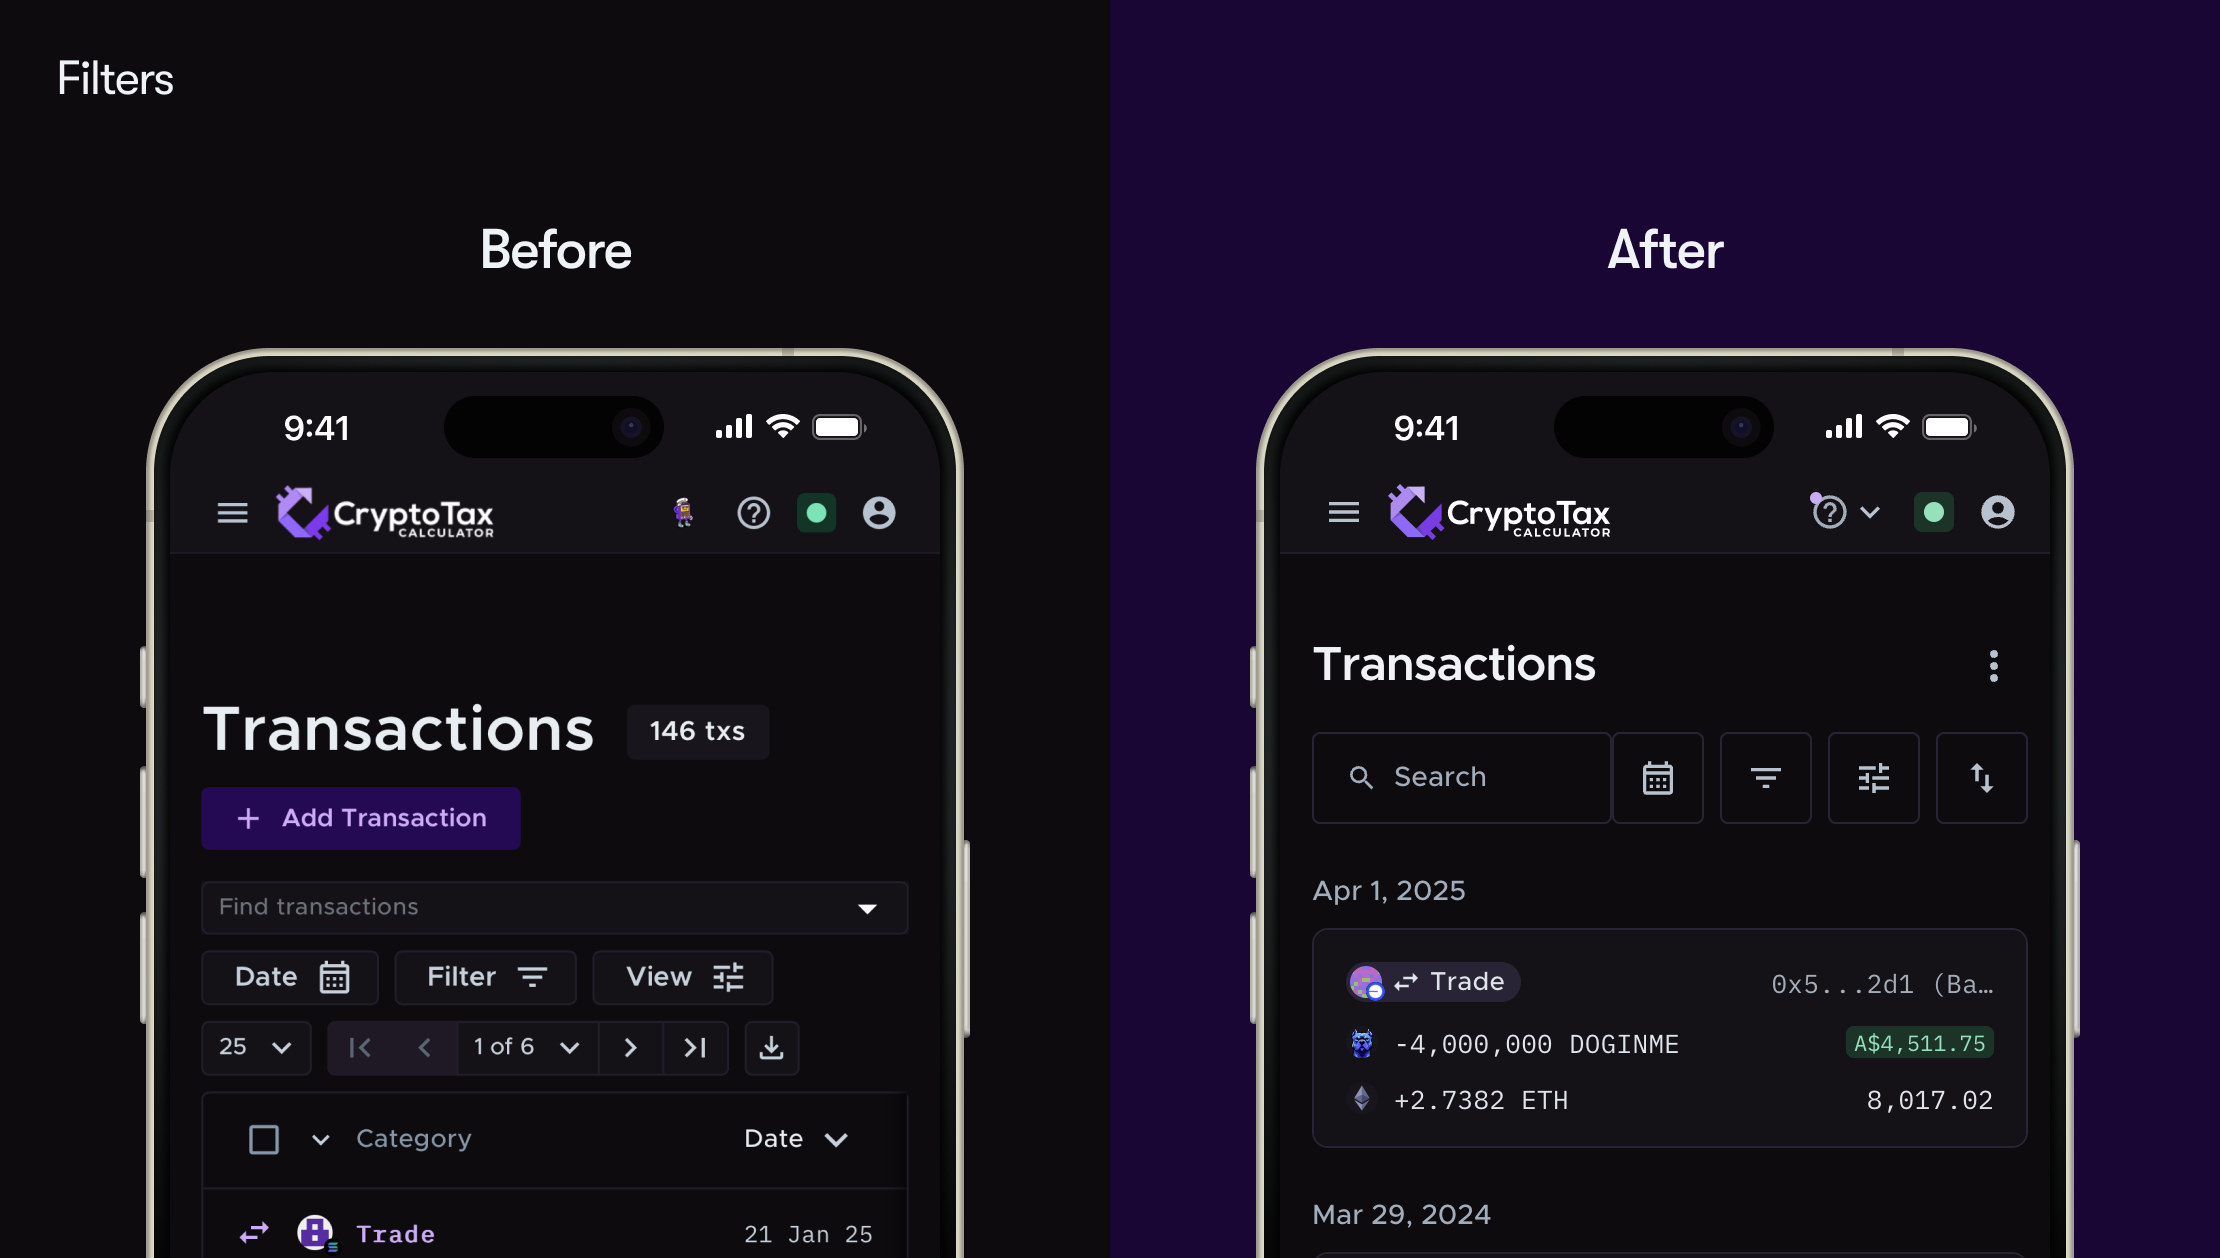
Filters were a desktop control strip: pagination, view toggles, chips, all competing with the first transaction. After, search and a few icon buttons stay in the chrome; the rest lives in a sheet. Progressive disclosure, and a pattern people already know how to close.
Around the loop
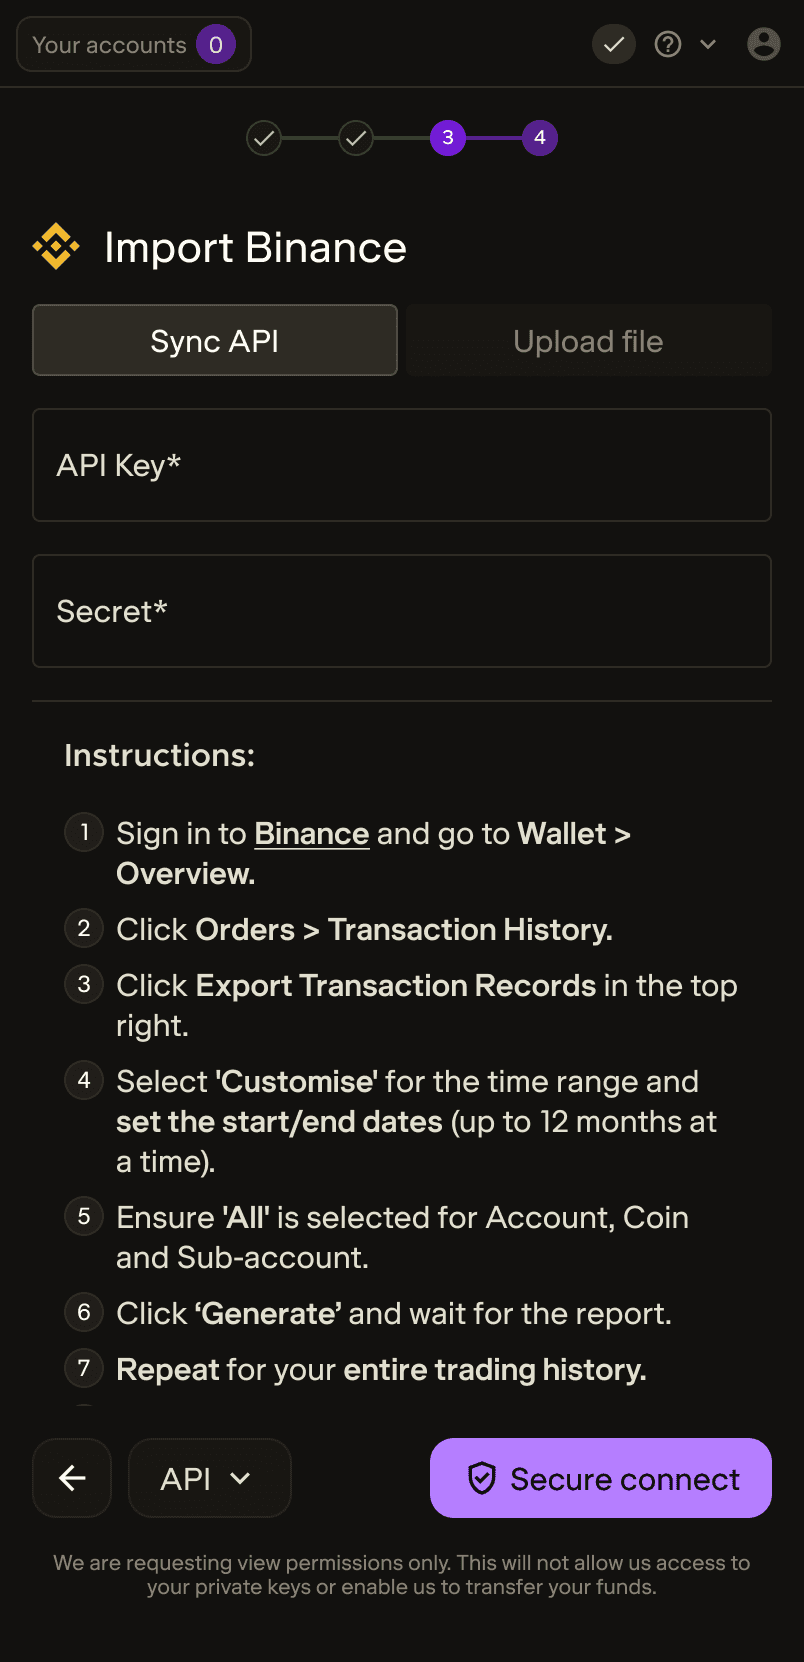
The same scannability rule on the rest of the loop: viewing history, landing on portfolio after onboarding, connecting an exchange as a job rather than a settings form.
Viewing transactions
Landing on portfolio after onboarding